Coffee Production’s Carbon Footprint: What the Data Shows
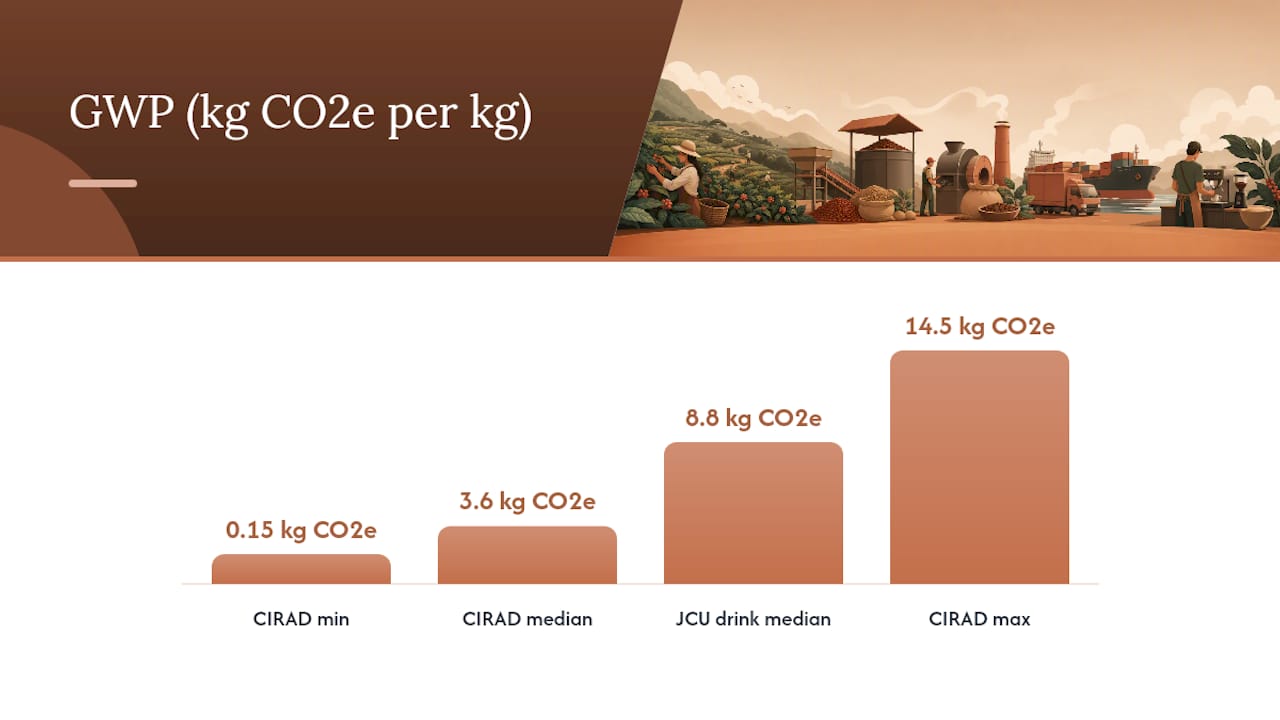
Coffee’s carbon footprint in production typically runs between 0.15 and 14.5 kg CO2e per kilogram of green coffee, with a median of 3.6 kg CO2e/kg across 34 reviewed studies. At the drink level, that range widens to 2–23 kg CO2e per kilogram of consumed coffee, with a median near 8.8 kg CO2e/kg. Three stages account for most of that load:
- Fertilizer manufacture and field N2O emissions from nitrogen application, often the single largest on-farm contributor in intensive systems
- Land-use change and deforestation, which can push individual farm footprints to the high end of the range when forest is cleared for new plantations
- Wet-processing wastewater and fermentation, a large and frequently underreported methane source
One persistent myth: that shipping coffee across oceans is a major climate problem. Sea freight is a relatively minor contributor to total lifecycle emissions. Air freight is a different story entirely, as one paired-case LCA study found that switching from air to cargo ship, combined with reduced agrochemical inputs, cut the product carbon footprint by 77%.
Table of Contents
- Which stages of production drive the most emissions?
- The most effective ways to reduce coffee’s climate impact
- How agroforestry and soil carbon change the net picture
- What roasters, traders, and buyers should do now
- Understanding LCA methods and where these figures come from
- Deforestation and biodiversity loss go beyond carbon
- Do certification schemes actually reduce coffee’s carbon footprint?
- Carbon offsets for coffee producers: what works and what does not
- Key Takeaways
- The evidence points somewhere most brands ignore
- Moustachecoffeeclub sources coffee the way the evidence suggests it should be done
- FAQ
- Primary sources and further reading
Which stages of production drive the most emissions?
On-farm: fertilizer and land-use change dominate
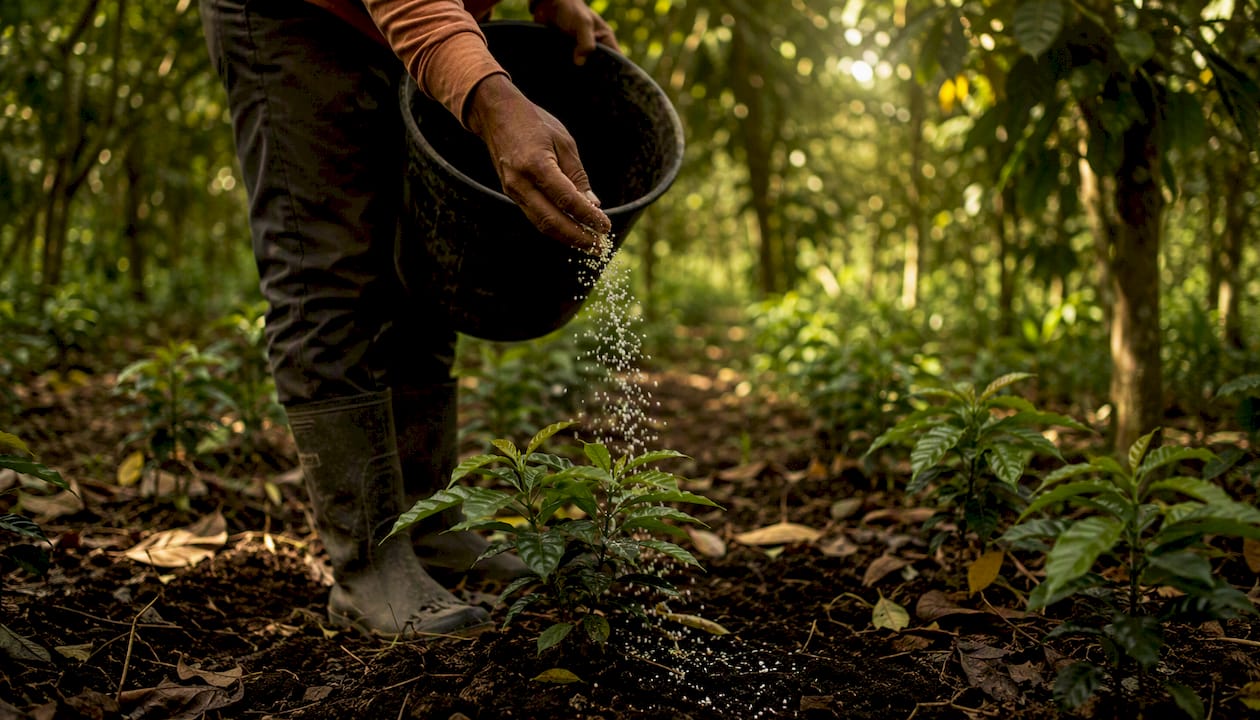
Nitrogen fertilizer is the most consistent hotspot. Meta-analyses report fertilizer contributions accounting for the majority of production-stage footprints in intensive systems, driven by both the energy-intensive Haber-Bosch manufacturing process and direct N2O emissions when nitrogen breaks down in soil. N2O has a global warming potential roughly 273 times that of CO2 over a 100-year horizon (IPCC AR6), which means even modest over-application has an outsized climate effect.
Land-use change is the wildcard. When forest is cleared for new coffee plantations, the carbon stored in that biomass is released over years to decades. Studies that include LUC in their system boundary consistently produce the highest footprint estimates.
Processing: wet vs. dry
Wet processing generates wastewater with high organic load. As that wastewater ferments, it releases methane, a potent greenhouse gas. Many LCAs either omit this entirely or model it inconsistently, which partly explains why upper-range estimates are so much higher than lower-range ones. Dry (natural) processing avoids most of this wastewater burden, though it carries its own trade-offs in water use and quality consistency.
Transport, roasting, and brewing
| Stage | Typical contribution (% of cradle-to-cup) | Key driver |
|---|---|---|
| On-farm (fertilizer + N2O) | — | Nitrogen management, yield |
| Land-use change | — | Deforestation, land history |
| Wet processing / wastewater | 5– | Methane from fermentation |
| Transport (sea) | 3–8% | Distance, load efficiency |
| Transport (air) | Can exceed farm stage | Freight mode choice |
| Roasting | 2–6% | Energy source, efficiency |
| Brewing + milk | 10– | Milk type, energy mix |
Sea freight is genuinely small. Air freight is not, and it can exceed the entire farm-stage footprint when used for green bean shipments.
The most effective ways to reduce coffee’s climate impact
1. Fertilizer efficiency on the farm
Nitrogen management is the highest-leverage intervention available. Precision application, split dosing, and organic nitrogen sources (compost, cover crops) all reduce both the manufacturing emissions embedded in synthetic fertilizer and the N2O released in the field. A field study of smallholder plots in Kenya using no-till, mulching, and composting showed yield gains and disease suppression up to 89–93% with comparable input costs, suggesting the transition does not require farmers to accept lower income.
2. Avoided deforestation and zero-deforestation sourcing
No mitigation lever at the farm level comes close to the impact of keeping forest standing. Buyers who require zero-deforestation commitments from suppliers, backed by satellite monitoring and supply-chain traceability, remove the highest-emission scenarios from their portfolios entirely.
3. Switching from air freight to sea freight
The paired-case LCA cited earlier found a 77% reduction in product carbon footprint when combining a shift from air to cargo ship with reduced agrochemical inputs. Air freight for green beans is rare but not absent, particularly for micro-lots and competition coffees. When it occurs, it dominates the logistics footprint.
4. Wet-processing wastewater treatment
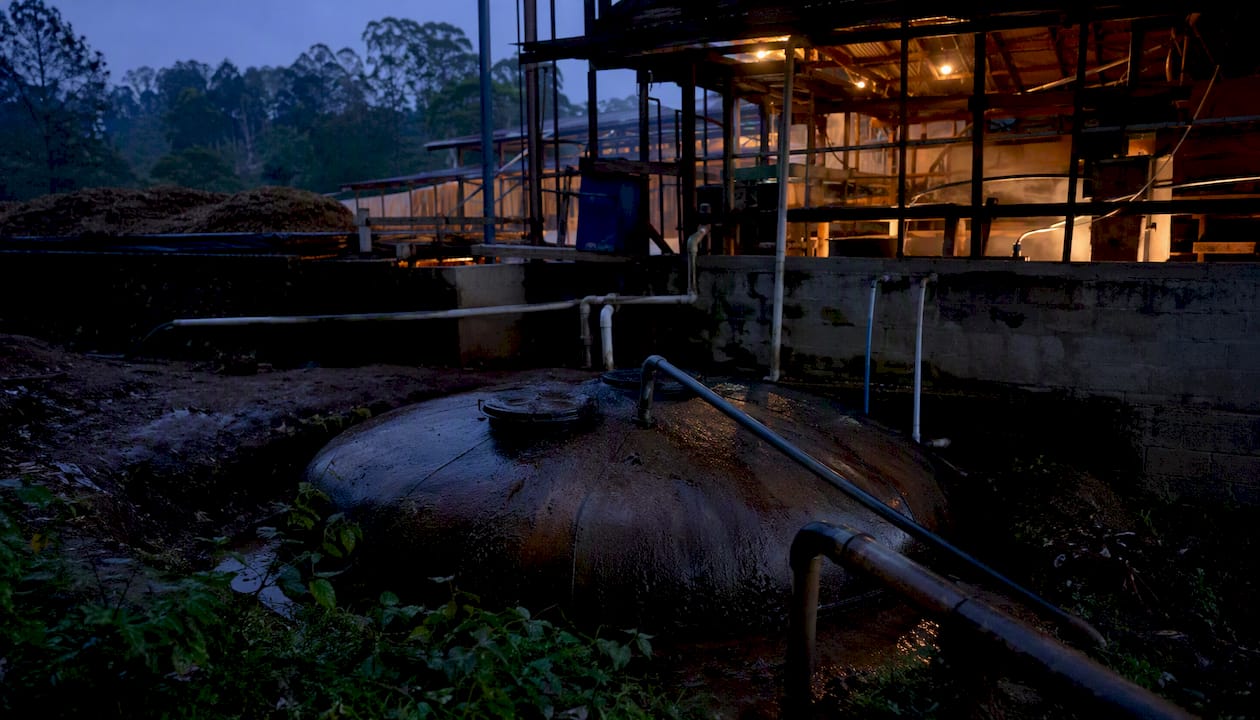
Installing biodigesters or constructed wetlands to capture methane from processing wastewater converts a large emission source into either energy or a neutralized effluent. This is a processing-mill intervention, not a farm-level one, but it targets one of the most underreported hotspots in the supply chain.
5. Renewable energy for roasting
Roasting contributes a relatively small share of total lifecycle emissions, but it is the stage most directly under a roaster’s control. Switching to renewable electricity and optimizing roast profiles for energy efficiency are straightforward interventions with measurable results. For more on sustainable roasting practices, the specifics of drum efficiency and batch sizing matter more than most roasters realize.
6. Brewing method and milk choices for consumers
Milk is the single largest consumption-stage variable. Switching from dairy to oat or almond milk cuts the drink-level footprint more than almost any other consumer behavior change. Among brewing methods, batch brew and French press use less energy per cup than single-serve pod machines, which also generate packaging waste. The effect of brewing method on both flavor and emissions is worth understanding before buying equipment.
Pro Tip: For roasters and traders, the sequence that delivers the most sustained reduction is: measure first (establish a baseline PCF with a stated system boundary), then target the top two hotspots for your supply chain, then fund farmer-level support for fertilizer efficiency, then shift procurement toward agroforestry and regenerative sources.
How agroforestry and soil carbon change the net picture
Agroforestry coffee systems, where shade trees grow alongside coffee plants, sequester substantially more carbon than unshaded monocultures. A meta-analytical review found that agroforestry systems store far more carbon than unshaded equivalents, with the median area-based carbon footprint across primary production running approximately 2,954 CO2e per hectare per year. Aboveground tree biomass accounts for most of the measured sequestration in coffee agroforests.
This matters for net warming outcomes, but the accounting is not simple. Additionality is the core question: does planting shade trees on a farm that would otherwise have had them anyway represent a genuine climate benefit? Temporal dynamics add another layer. Trees sequester carbon over decades, while emissions from fertilizer and processing occur annually. Amortizing the sequestration benefit over the right time horizon is a methodological choice that changes the net footprint significantly.
Practical steps to increase on-farm carbon stocks:
- Plant diverse shade tree species with high biomass accumulation rates
- Maintain cover crops and mulch layers to build soil organic matter
- Avoid tillage that disrupts soil carbon stocks
- Apply compost to replace synthetic nitrogen and feed soil biology
World Coffee Research guidance on carbon accounting for coffee farms provides a framework for measuring these stocks and integrating them into farm-level carbon budgets.
What roasters, traders, and buyers should do now
Measurement is the non-negotiable first step. Without a stated system boundary, a functional unit, and a baseline product carbon footprint, every subsequent claim is unverifiable. The Cool Farm Tool and the Cool Farm Coffee Working Group outputs are increasingly the industry standard for on-farm carbon accounting, offering a structured methodology that aligns with IPCC GWP factors and allows cross-farm comparison.
Procurement priorities, in order of impact:
- Require zero-deforestation commitments with satellite-verified land-use screening
- Prefer suppliers who disclose fertilizer application rates and processing method
- Prioritize agroforestry and regenerative-certified origins where LUC risk is high
- Eliminate air-freighted green coffee from routine procurement; reserve it only for justified exceptional cases
- Track yield-normalized PCF, percentage of supply with LUC screening, and percentage shipped by sea as standing KPIs
Farmer support is where procurement decisions translate into real emission reductions. Fertilizer efficiency programs, regenerative practice training, and financing for processing infrastructure (biodigesters, wastewater treatment) all require upfront investment that most smallholders cannot self-fund. Buyers who build these costs into premiums rather than treating them as optional CSR create durable supply-chain change. For a deeper look at how specialty coffee sourcing supports farmers economically, the connection between premium pricing and practice adoption is direct.
On claims and offsets: carbon offsets purchased on voluntary markets are a last resort, not a first step. Insetting, meaning investing in emission reductions within your own supply chain, delivers more verifiable outcomes and builds supplier relationships simultaneously. Any public carbon claim should disclose the system boundary, the GWP version used, and whether LUC is included.
Understanding LCA methods and where these figures come from
Life cycle assessment (LCA) is the standard methodology for quantifying environmental impacts across a product’s supply chain. “Cradle-to-gate” covers primary production through export; “cradle-to-cup” extends through roasting, retail, brewing, and disposal. The functional unit, the denominator used to normalize results, determines whether you are comparing per-kg green beans, per-kg roasted coffee, per-liter brewed, or per cup served.
All GWP conversions in this article use the IPCC 100-year global warming potential (GWP100) framework, consistent with the most widely cited LCA studies in the coffee literature.
Key sources underpinning the figures above:
- The CIRAD review of 34 studies provides the 0.15–14.5 kg CO2e/kg range and 3.6 kg median
- The JCU systematic review supplies the drink-level median of 8.8 kg CO2e/kg consumed coffee and the methodological variability analysis
- The University of Toronto meta-analysis provides area-based and product-based primary production metrics and agroforestry sequestration data
- The Wiley GEO paired-case LCA supplies the 77% reduction scenario and the conventional vs. sustainable production comparison
- World Coffee Research carbon accounting guidance covers on-farm measurement tools and agroforestry accounting
- The Springer cradle-to-grave LCA covers consumption-stage variables including milk and energy mix
- The Frontiers regenerative practice study provides field evidence from Kenya on yield and disease outcomes under eco-friendly management
- The ScienceDirect meta-analysis details fertilizer contributions and methodological inconsistencies
Deforestation and biodiversity loss go beyond carbon
Carbon numbers alone understate what coffee expansion costs when it occurs at the forest frontier. Deforestation for new coffee plantations destroys habitat for species that cannot survive in open agricultural land. In Ethiopia’s Kaffa region, the Bale Mountains, and parts of Central America, coffee expansion has historically fragmented forest corridors that support endemic bird species, pollinators, and large mammals. The carbon released from that deforestation is measurable; the biodiversity lost is not recoverable on any human timescale.
Shade-grown and agroforestry systems partially address both problems simultaneously. They maintain canopy cover that supports bird diversity, preserve soil structure that supports invertebrate communities, and retain the hydrological function of forest edges. Certification schemes that require canopy retention, like Rainforest Alliance’s shade requirements, are attempting to operationalize this dual benefit at scale. The carbon sequestration benefit of those shade trees is real, but the biodiversity benefit may be the more durable argument for maintaining them, particularly as carbon markets fluctuate in value and credibility.
Do certification schemes actually reduce coffee’s carbon footprint?
Rainforest Alliance, Fair Trade, and organic certifications each address parts of the emissions picture, but none was designed primarily as a carbon standard, and the evidence on footprint reduction is mixed.
Rainforest Alliance’s Sustainable Agriculture Network standard requires canopy cover retention, which supports sequestration and biodiversity. It restricts certain synthetic inputs, which can reduce fertilizer-related N2O emissions. What it does not do is require a measured product carbon footprint or mandate specific emission targets.
Fair Trade certification focuses on price floors and community investment. It can indirectly support lower-emission practices by giving farmers financial stability to invest in compost infrastructure or shade tree planting, but the certification itself does not track or verify emission outcomes.
Organic certification eliminates synthetic nitrogen fertilizer, which removes the largest single on-farm emission driver in intensive systems. The trade-off is yield: organic coffee typically produces less per hectare, which means more land is needed for the same output. Whether that land-use effect nets out positively depends entirely on whether the additional land comes from forest conversion or existing agricultural land.
The honest assessment: certifications are useful proxies when direct carbon data is unavailable, but they are not substitutes for disclosed, measured footprints. A roaster sourcing certified coffee without knowing the farm system, processing method, or freight mode is still operating with significant blind spots.
Carbon offsets for coffee producers: what works and what does not
Carbon offsets allow producers or buyers to compensate for emissions by funding reductions elsewhere. In theory, a coffee farm that cannot immediately eliminate its fertilizer use can purchase verified credits from a reforestation project to balance its footprint. In practice, the quality of offset markets varies enormously.
For coffee producers specifically, the most credible offset strategies are those that stay within the supply chain. Funding biodigester installation at a wet-processing mill, financing shade tree planting on supplier farms, or supporting fertilizer efficiency programs at origin all reduce emissions that are directly attributable to the supply chain. These are insetting strategies, and they tend to produce more verifiable outcomes than purchasing credits on open voluntary markets.
The Global Coffee Platform’s RegenCoffee guidance and the Cool Farm Tool’s Coffee Working Group outputs both push toward this insetting model, emphasizing harmonized accounting methods and direct farmer support over offset purchasing. The CDP reporting framework, used by larger institutional buyers, requires disclosure of Scope 3 emissions including supply-chain agriculture, which is pushing more buyers toward measured insetting rather than offset purchasing.
For individual producers without access to these programs, Verra’s Verified Carbon Standard (VCS) and Gold Standard both offer methodologies applicable to agricultural land management and agroforestry. The verification cost is a barrier for smallholders, which is why aggregated programs run through cooperatives or exporters tend to be more practical at origin.
Key Takeaways
Coffee’s carbon footprint in production is dominated by on-farm fertilizer use, land-use change, and wet-processing emissions, with a median of 3.6 kg CO2e per kilogram of green coffee across major reviews.
| Point | Details |
|---|---|
| Median footprint | 3.6 kg CO2e/kg green coffee; drink-level median is 8.8 kg CO2e/kg consumed coffee. |
| Top emission hotspots | Fertilizer N2O, land-use change, and wet-processing wastewater drive most of the footprint. |
| Freight mode matters | Switching from air to sea freight, combined with lower agrochemical inputs, cut one study’s PCF by 77%. |
| Agroforestry sequesters carbon | Shade-grown systems store substantially more carbon than unshaded monocultures; median area footprint is ~2,954 CO2e/ha/yr. |
| Moustachecoffeeclub’s approach | Moustachecoffeeclub sources single-origin beans with ethical sourcing practices and ships via sea-freight-aligned logistics, supporting lower-footprint supply chains. |
The evidence points somewhere most brands ignore
Coffee’s sustainability conversation gets stuck on packaging and offsets because those are the levers brands control directly. The data points somewhere harder: the farm, the processing mill, and the freight decision. A beautifully designed compostable bag on a coffee that arrived by air freight from a deforested hillside is not a sustainability story. It is a distraction.
What the LCA literature consistently shows is that the highest-leverage interventions require supply-chain relationships, not just purchasing decisions. Roasters who know their farmers, who fund fertilizer efficiency programs, who can verify that their green coffee arrived by sea, and who can state the farming system behind each origin are doing the work that actually moves the needle. The rest is marketing.
The other thing the research makes clear: consumers are not powerless, but their most powerful action is choosing roasters who are doing that work, not switching to a slightly greener brewing method while continuing to buy from opaque supply chains. Milk reduction matters. Brewing method matters. But sourcing transparency matters more.
Moustachecoffeeclub sources coffee the way the evidence suggests it should be done
If you have read this far, you already know that the carbon footprint of your coffee is mostly determined before it reaches a roaster. Origin matters. Farming system matters. How the beans got to the U.S. matters.

Moustachecoffeeclub builds subscriptions around single-origin beans sourced from farms in Ethiopia, Colombia, and other high-quality origins, roasted ultra-light in the Nordic tradition and shipped day-of-roast. The sourcing philosophy prioritizes transparency: origin reports, ethical sourcing practices, and reduced plastic packaging are part of the standard offering, not an upgrade. For readers who want to go deeper on what that means in practice, the coffee education hub covers sourcing, brewing, and sustainability in detail. When you are ready to receive freshly roasted, traceable single-origin beans on a schedule that works for you, start your subscription here.
FAQ
What is the average carbon footprint of a cup of coffee?
A black cup of coffee typically contributes well under 0.1 kg CO2e per serving, based on the farm-level median of 3.6 kg CO2e/kg green coffee. Adding dairy milk roughly doubles or triples the drink-level footprint depending on volume and milk type.
What causes the biggest emissions in coffee production?
Nitrogen fertilizer manufacture and field N2O emissions are the dominant on-farm driver, followed by land-use change when forest is cleared for new plantations. Wet-processing wastewater fermentation is a large but frequently underreported source.
Does shipping coffee by air significantly increase its carbon footprint?
Yes. A paired-case LCA found that switching from air freight to cargo ship, combined with reduced agrochemical inputs, produced a 77% reduction in product carbon footprint. Sea freight is a minor contributor to lifecycle emissions; air freight can exceed the entire farm-stage footprint.
Does organic or Rainforest Alliance certification guarantee a lower footprint?
Not automatically. Organic certification eliminates synthetic nitrogen, which removes the largest on-farm emission driver, but lower yields can require more land. Rainforest Alliance requires canopy retention, which supports sequestration. Neither certification mandates a measured product carbon footprint.
How can I verify a roaster’s sustainability claims?
Ask three questions: What farming system was used at origin? How was the green coffee shipped to the U.S.? Does the roaster publish any carbon or sustainability disclosures? Credible claims include a stated system boundary, disclosed processing method, and sea-freight confirmation.
Primary sources and further reading
The figures and ranges in this article draw from the following sources:
- Review on Green Coffee Carbon Footprint
- GEO: Geography and Environment — Wiley Online Library
- Unravelling life cycle impacts of coffee: Why do results differ so much among studies?
- Carbon Accounting for Coffee-Based Farming Systems
- Frontiers in Sustainable Food Systems — eco-friendly coffee management study
- Carbon footprints and CO2 removal in primary production of coffee: a meta-analytical review
Recommended
- Carbon Footprint of Coffee Delivery Subscriptions | Blog | The Moustache Coffee Club
- Why Consumer Choices Affect Coffee Farmers: 2026 Guide | Blog | The Moustache Coffee Club
- Sustainable Coffee Roasting Practices: A 2026 Guide | Blog | The Moustache Coffee Club
- How Coffee Brands Practice Sustainability in 2026 | Blog | The Moustache Coffee Club